In the ever-evolving landscape of web development, groundbreaking and innovative technologies have consistently reshaped the way we create and interact with web applications, with browser engines like V8 (used in Google Chrome) and SpiderMonkey (used in Mozilla Firefox) playing a pivotal role in enabling developers to create applications that are fast, efficient, and powerful.
Among these innovations, WebAssembly has unlocked a world of possibilities for developers and pushed the boundaries of what the web can do. As a low-level, binary instruction format, WebAssembly allows high-level languages like C, C++, and Rust to be efficiently compiled and executed in web browsers, bridging the performance gap between JavaScript and native code. This breakthrough has empowered developers to tackle complex, computationally intensive tasks such as 3D graphics, multimedia processing, and real-time simulations, significantly enriching the web experience for users across the globe.
However, the rise of Apple Silicon and its arm64 architecture presents new challenges in optimizing WebAssembly-based applications and countless projects that have pushed its boundaries, including WebContainers and esbuild.
In this blog post, we will discuss a performance issue with Apple Silicon and browser engines, such as V8 and SpiderMonkey, that we encountered last year in August in WebContainers, which for a few months was quite an impediment to some of our users. Let’s go on a journey to understand exactly what the issue was. Fasten the seatbelt as we will wade through Assembly code, examine machine instructions, and explore a whole lot more. Adventure awaits!
TL;DR
Performance issues with Apple Silicon (arm64) affecting WebContainers have been fixed as of Chrome 112 and are expected to ship with Firefox 114.
Too Slow for My Taste
Our story begins with Vite. When Matias (aka Patak) attempted to use Codeflow on Vite’s core repository, he noticed that loading files weren’t instant, especially while running other processes. In addition, running the development build was extremely slow and took minutes! Outrageous, because WebContainers are blazingly fast! That’s when Matias reached out to the WebContainer team, the team that’s driving the efforts on the core runtime, for help. After reproducing the issue, we discovered that only Apple Silicon-based machines (arm64 chips) were suffering from the performance problem. The fact that we could reproduce the issue in both Chrome and Firefox but not Safari suggested that it wasn’t an engine-specific quirk but something more low-level.
To help address the issue, we filed a bug report for both Chrome and Firefox, hoping that the browser vendors would investigate the matter. As it turned out, there was already a related bug filed over a year earlier about a WebAssembly multithreading demo that ran a lot slower on M1 machines compared to their single-threaded counterparts. At this point, the prime suspect appeared to be WebAssembly. And it all adds up, considering Vite leans on esbuild (esbuild-wasm) and our kernel is practically best friends forever with WebAssembly threads and therefore heavily relies on WebAssembly’s capability to operate with shared linear memory.
Fast forwarding to February 20, 2023, Pierre Langlois, a Staff Software Engineer at Arm, submitted a fix for V8. Soon after, Ryan Hunt who is a Software Engineer at Mozilla, submitted a first proof of concept for Firefox. The issue was then later assigned to Yury Delendik, who submitted two revisions that updated VIXL with Armv8.1 atomic memory instructions and ensured that these instructions were used for atomic operations. Big shoutout to Pierre, Ryan and Yury for investigating and working out fixes! 🙏
VIXL is a code generation library that contains multiple parts, including assemblers to generate ARMv8 code at runtime, disassemblers to print instructions emitted by the assembler, and a simulator to simulate instructions.
I looked at the changes, which, to be be frank, initially seemed quite baffling. Being driven by curiosity, I really wanted to wrap my head around it. I have to say, it’s been nothing but fascinating, which is why I wanted to share this with you all and let you in on the fun — let’s have a look together!
The Problem: Atomic Instructions
If we look at the pull request for V8 it says the following:
[arm64] Generate LSE atomic instructions when available.

If the platform support AArch64 LSE instructions, generate them instead
of LL/SC loops. If the new instructions can be supported at compile-time,
we generate them for JS builtins and Wasm jitted code. Otherwise, if they
are only available at runtime, we only use them in jitted code.
If we unpack this, we can find our first clue on the first line, which mentions generating “LSE atomic instructions” when available. Let’s have a look at what LSE atomic instructions are and how they relate to the problem.
LSE Atomic Instructions and WebAssembly
In programming, when shared data is accessed concurrently by multiple processors or threads, including at least one write operation, it’s crucial to ensure that memory operations are executed in an atomic manner, meaning they are indivisible and cannot be interrupted by other threads or processes. Arm64 always supported atomic instructions. However, prior to Armv8.1, which is a specific version of the architecture, the instruction set didn’t feature native read-modify-write (RMW) instructions. These were only introduced with Armv8.1 or Armv8.1-A (A-profile that offers the highest performance of all architecture profiles) as a mandatory feature. The Arm Architecture Reference Manual refers to atomic instructions as Large System Extensions (LSE). Okay, but is it such a big deal whether it features native RMW instructions or not? Actually it is, specifically for browser engines like V8 or SpiderMonkey, and the machine code they generated for a Wasm module — more on this in a bit.
Now, the WebAssembly Threads proposal introduces shared linear memory as well as atomic memory access instructions. Memory access can be separated into three categories:
- load/store,
- read-modify-write, and
- compare-exchange
As we can see, part of the threads proposal are read-modify-write instructions that involve atomically reading a value from memory, modifying it, and then writing the result back to memory. There is a handful of these instructions but one that is particularly interesting is i32.atomic.rmw.xchg or the 64-bit variant. It reads the value currently stored at the given memory address, replaces it with the new value, and returns the original value.
To illustrate this, let’s have a look at an example of a Wasm module that uses this atomic RMW instruction:
(module
  (memory (export "memory") 1 1)
  (func (export "main") (result i32)
    i32.const 0
    i32.const 1
    i32.atomic.rmw.xchg
  )
)
This code defines a simple module with an exported single-page memory and an exported function named main. Inside the function, we atomically replace the value at memory address 0 (which will be 0 by default) with 1 and return the result of i32.atomic.rmw.xchg, which is the old value that was stored at that memory address.
This code in itself is totally valid. In fact, such atomic RMW operations are quite common in multi-threaded applications, such as WebContainers. So this is not the full story and we have to go back to the PR to look for another clue. One thing that stands out is that it talks about generating LSE instructions. To understand what this means, let’s have a brief look at what browser engines do if you instantiate and run a WebAssembly module.
Generating Machine Code
For quite some time, JavaScript engines have been using tiered compilers. There’s usually a baseline interpreter (Tier 1) and an optimizing compiler (Tier 2). Typically, the Tier 2 compiler is only utilized when it has collected enough runtime information because JavaScript is dynamically typed or a specific code segment becomes “warm”, meaning it is frequently called.
For WebAssembly that’s slightly different. The pipeline usually uses a baseline compiler (Tier 1), which already generates machine code, and proactively kicks off the optimizing compiler (Tier 2) to perform a full re-compilation in the background to generate optimized machine code.
Simplified, V8’s tiered WebAssembly compilation pipeline looks like this:
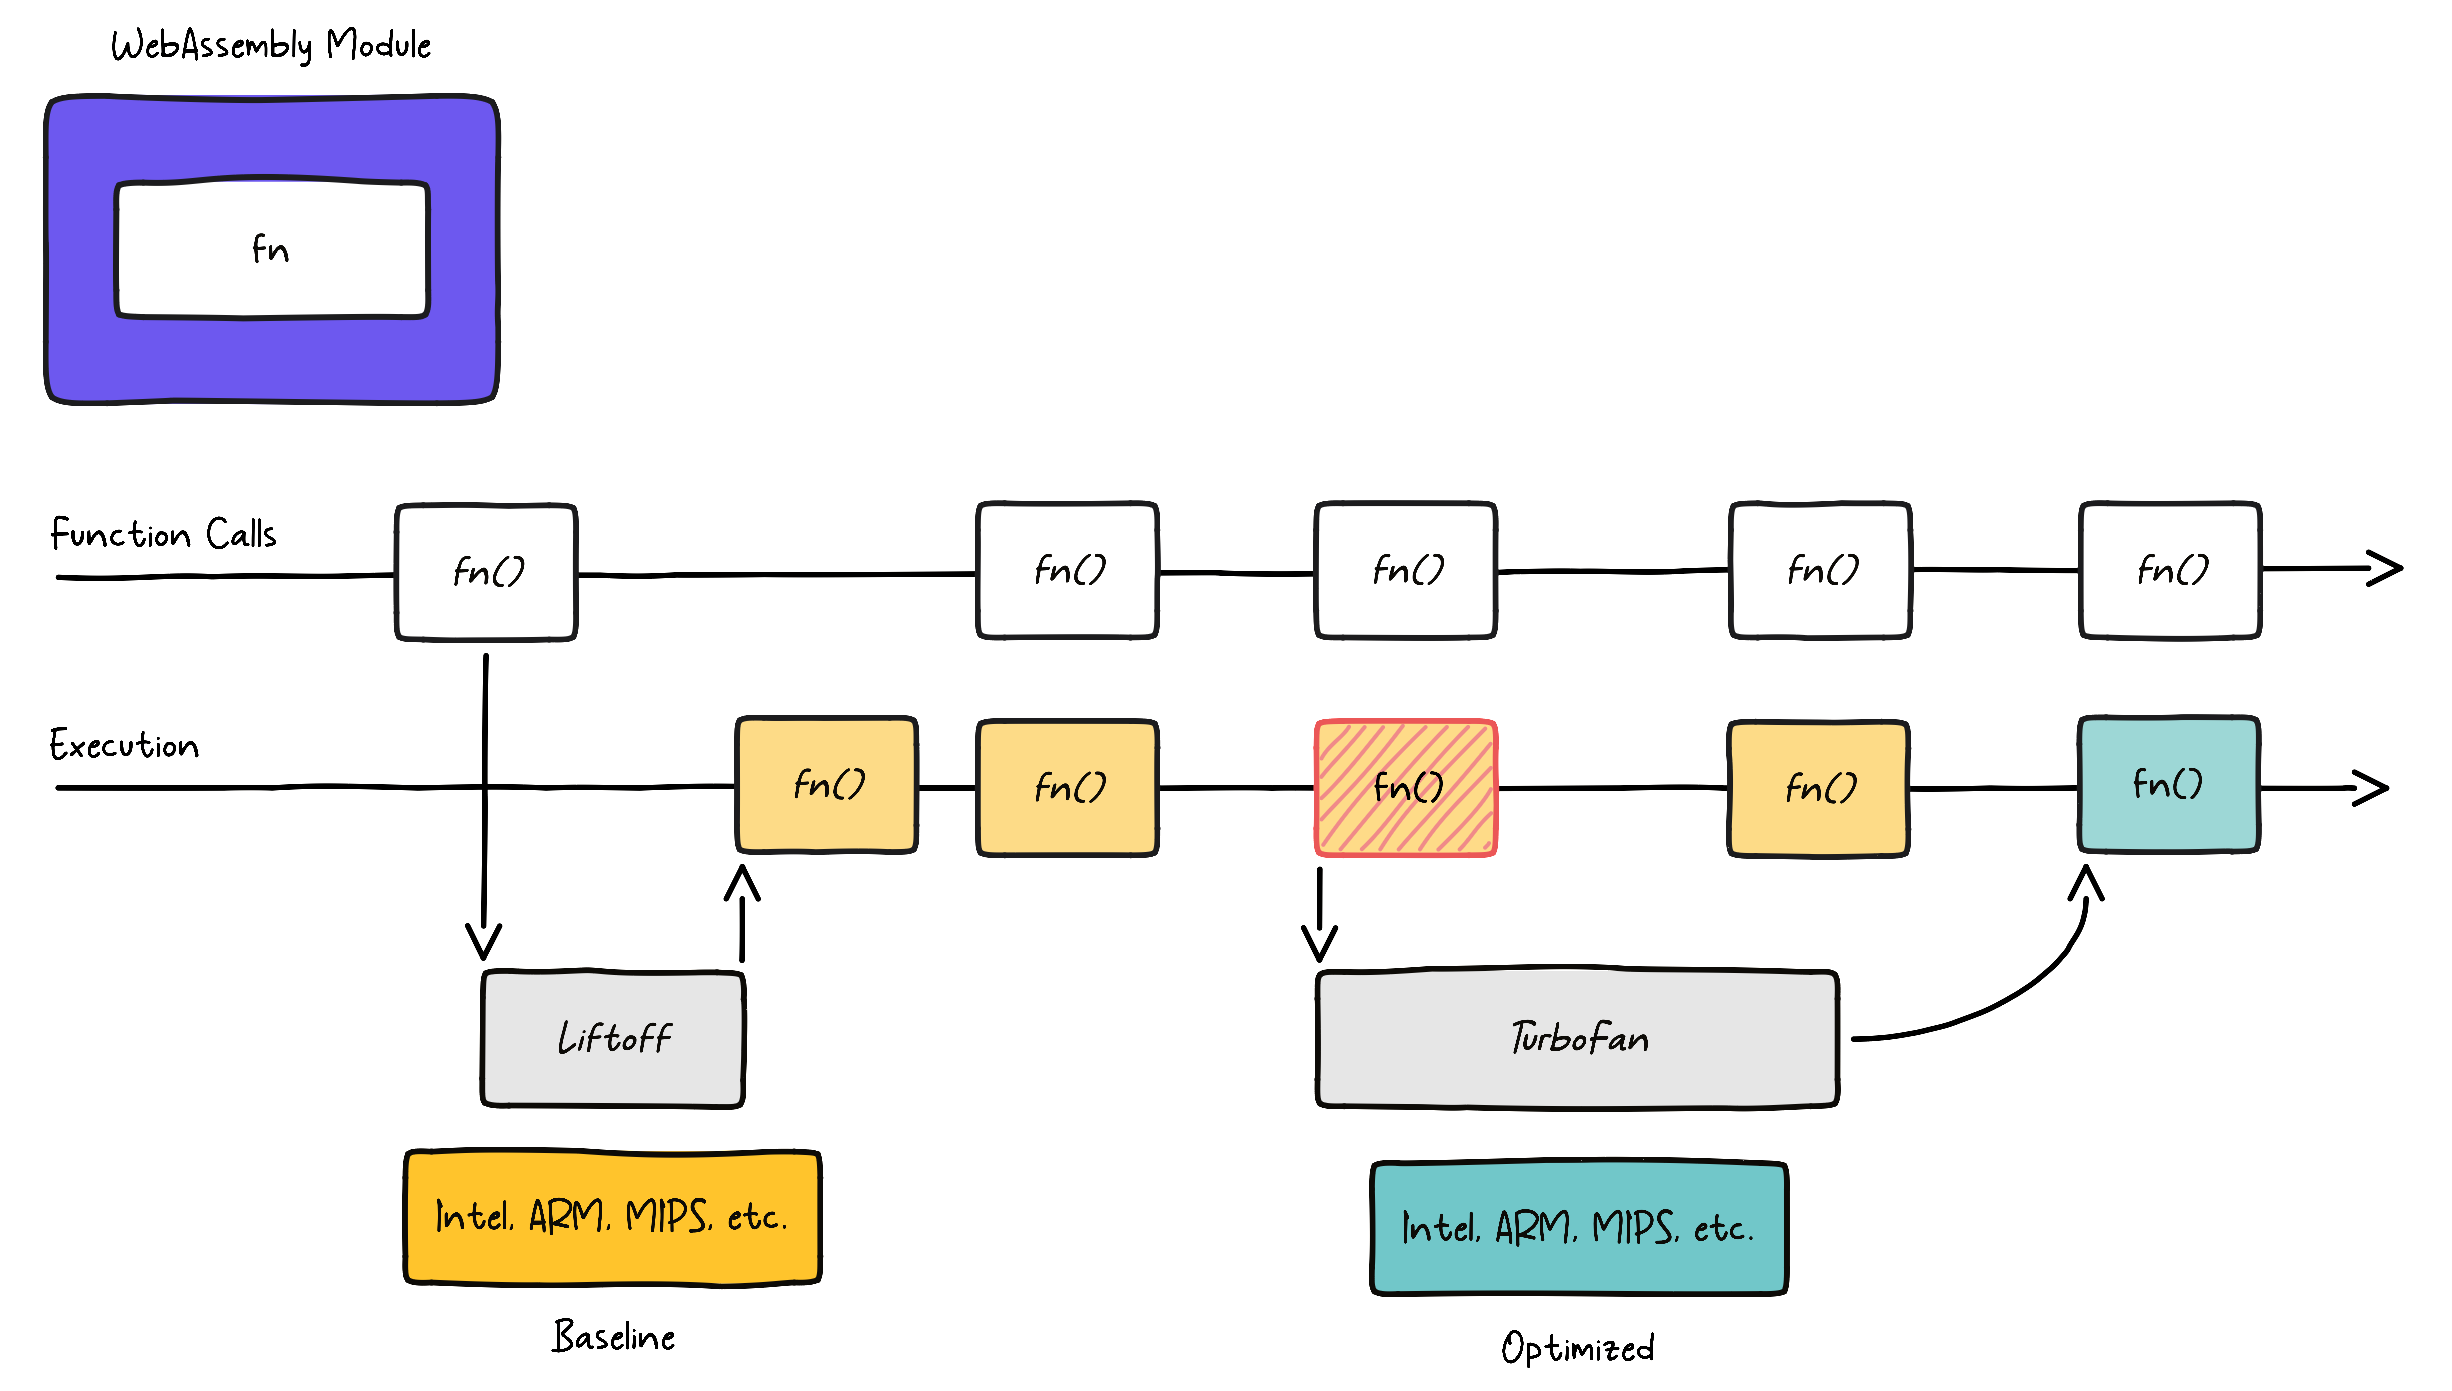
V8 features two compilers: a baseline compiler named Liftoff for fast startup times and TurboFan as the optimizing compiler for maximum performance. Both compilers generate machine code for the underlying system architecture, such as x86 or arm64. However, Liftoff is much faster at generating code because its compilation pipeline is simpler. It uses a function body decoder that lazily generates code for functions upon first call. That means it has to suspend execution until the function has been compiled by Liftoff. As depicted in the image above, V8 uses a dynamic tier-up strategy for WebAssembly, similar to JavaScript. TurboFan tiers up in the backend as soon as it gets sufficiently many calls, meaning a function gets “hot” (illustrated in red). The function gets optimized in the background and code execution continues on Liftoff code until the optimized code is ready.
This information will be useful in a moment, but the most interesting part here is that both compilers generate machine code. I suggest we dive deeper and have a closer look at the code that gets generated for our small Wasm module above.
Inspecting Machine Code
Both V8 and SpiderMonkey include tools that allow us to run or debug snippets of JavaScript without using a browser. For example, V8 ships with a developer shell called d8. To use d8, we need to build V8 from source (if you want to do the same, check out the docs). To inspect the generated machine code for the Wasm module prior to LSE we must check out the commit before it got fixed (aec26a1763). It’s important to compile for arm64 and to enable the disassembler as well as object print. Here’s the the full build configuration for an arm64.release build:
  is_component_build = false
  is_debug = false
  target_cpu = "arm64"
  v8_target_cpu = "arm64"
  v8_enable_sandbox = true
  use_goma = false
  v8_enable_backtrace = true
+ v8_enable_disassembler = true
+ v8_enable_object_print = true
  v8_enable_verify_heap = true
  dcheck_always_on = false
After V8 was compiled, we can find the d8 binary out/arm64.release.
To recall, we are trying to inspect the machine code that V8 generates for atomic RMW operations on arm64. To do this, we need to compile our module from above to a binary blob. We can do this either with wasm-tools or wat2wasm. For example, to print an array of bytes we can pipe the binary output to Node.js so we can more easily use it in some JavaScript code that we will write in a moment:
wasm-tools parse main.wat | node -e "process.stdin.on('data', (data) => console.log([...data]));"
We put the WAT (WebAssembly Text Format) code in a file called main.wat and parse it using wasm-tools. If we execute this shell command it prints the following:
[
  0, 97, 115, 109,   1,   0,   0,   0,   1,   5,   1, 96,
  0,  1, 127,   3,   2,   1,   0,   5,   4,   1,   1,  1,
  1,  7,  17,   2,   6, 109, 101, 109, 111, 114, 121,  2,
  0,  4, 109,  97, 105, 110,   0,   0,  10,  12,   1, 10,
  0, 65,   0,  65,   1, 254,  65,   2,   0,  11
]
Now, we create an index.js with the following content:
const bytes = new Uint8Array([
  0, 97, 115, 109, 1, 0, 0, 0, 1, 5, 1, 96, 0, 1, 127, 3, 2, 1, 0, 5, 4, 1, 1,
  1, 1, 7, 17, 2, 6, 109, 101, 109, 111, 114, 121, 2, 0, 4, 109, 97, 105, 110,
  0, 0, 10, 12, 1, 10, 0, 65, 0, 65, 1, 254, 65, 2, 0, 11, 0, 10, 4, 110, 97,
  109, 101, 2, 3, 1, 0, 0,
]);

const module = new WebAssembly.Module(bytes);
const instance = new WebAssembly.Instance(module);

console.log(instance.exports.main());

// we access the exported memory and print the value at index 0 which should be 1
console.log(new Uint8Array(instance.exports.memory.buffer).at(0));
First, we create a new Uint8Array with the bytes that make up the WebAssembly module. It’s the same bytes we just generated using wasm-tools. Finally, we create a WebAssembly module and instance. If we recall, the module exports a function main, which we call at the end, and console.log its result. Since we exported the memory from the Wasm module, we can access it and print the value at index 0 after we called the main function. If it works as expected, it should print 1.
./out/arm64.release/d8 --print-code --no-liftoff index.js
It’s important to pass --print-code, otherwise d8 will not print the generated code. Additionally, including --no-liftoff allows us to inspect the optimized machine code. It is also possible to examine the baseline code generated by Liftoff, though this is typically more verbose. However, I will leave this as an exercise for you.
If we don’t call the exported function then d8 won’t print any code. If we recall, that’s because Liftoff and TurboFan are lazy. In this case we could use -no-wasm-lazy-compilation to turn off lazy compilation for WebAssembly.
Let’s have a look at the output:
--- WebAssembly code ---
name: wasm-function[0]
index: 0
kind: wasm function
compiler: TurboFan
Body (size = 96 = 72 + 24 padding)
Instructions (size = 64)
0x44dc8c74680     0  a9bf7bfd       stp fp, lr, [sp, #-16]!
0x44dc8c74684     4  910003fd       mov fp, sp
0x44dc8c74688     8  d2800110       movz x16, #0x8
0x44dc8c7468c     c  a9bf43e7       stp x7, x16, [sp, #-16]!
0x44dc8c74690    10  f841f0e1       ldur x1, [x7, #31]
0x44dc8c74694    14  8b416381       add x1, x28, x1, lsr #24
0x44dc8c74698    18  d2800002       movz x2, #0x0
0x44dc8c7469c    1c  d2800023       movz x3, #0x1
0x44dc8c746a0    20  8b020021       add x1, x1, x2
0x44dc8c746a4    24  885ffc20       ldaxr w0, [x1]
0x44dc8c746a8    28  8802fc23       stlxr w2, w3, [x1]
0x44dc8c746ac    2c  35ffffc2       cbnz w2, #-0x8 (addr 0x44dc8c746a4)
0x44dc8c746b0    30  910003bf       mov sp, fp
0x44dc8c746b4    34  a8c17bfd       ldp fp, lr, [sp], #16
0x44dc8c746b8    38  d65f03c0       ret
0x44dc8c746bc    3c  d503201f       nop

Safepoints (entries = 0, byte size = 8)

RelocInfo (size = 0)

--- End code ---
0
1
There’s quite a bit of information here, but I want us to pay attention to the following code:
...
0x44dc8c74698    18  d2800002       movz x2, #0x0
0x44dc8c7469c    1c  d2800023       movz x3, #0x1
...
0x44dc8c746a4    24  885ffc20       ldaxr w0, [x1]
0x44dc8c746a8    28  8802fc23       stlxr w2, w3, [x1]
0x44dc8c746ac    2c  35ffffc2       cbnz w2, #-0x8 (addr 0x44dc8c746a4)
...
0x44dc8c746b8    38  d65f03c0       ret
0x44dc8c746bc    3c  d503201f       nop
...
This is the code that TurboFan generates for the i32.atomic.rmw.xchg at least prior to Armv8.1.
Overall, this code implements a spinlock loop for synchronizing access to shared data between multiple cores. A spinlock is a type of lock that doesn’t involve the operating system. When a thread attempts to acquire a spinlock that is already held by another thread, it will spin and repeatedly check the lock status in a loop, waiting for the lock to be released.
What the code does is it reads a value from a memory location with acquire semantics (ldaxr) and then tries to store the value back using store-release exclusive (stlxr). If the store fails because another thread or process modified the value in the meantime, the loop repeats, re-reading the value and trying again.
Registers are small, fast storage locations within the CPU (Central Processing Unit) that are used to hold data and instructions during processing. Most arm64 instructions operate on registers.
The architecture provides 31 general-purpose registers, labeled from x0 to x30. Each of these registers is 64 bits wide. This means that w2 and x2 are related in that with the w registers you access the lower 32 bits of the corresponding x register.
So any operation performed on a w register will only affect the lower 32 bits of the corresponding w register, and the upper 32 bits will be zeroed.
Let’s unravel this a bit more:
movz x2, #0x0: Themovz(move wide with zero) instruction moves an immediate value (here0x0) into the destination registerx2. It essentially initializesx2with the value0which corresponds to thei32.const 0instruction in our Wasm module and represents the memory index.movz x3, #0x1: Same as before, but initializesx3with the value1. This corresponds to thei32.const 1instruction in our Wasm module and represents the value we want to store in memory.ldaxr w0, [x1]:ldaxr(load-acquire exclusive register) performs an exclusive load from the address inx1into thew0register (32-bit register) while also setting an exclusive access monitor. The exclusive access monitor facilitates synchronization and atomic operations between different cores or threads. In arm64, the return value of a function is typically stored in thew0(orx0) register. Sinceldaxrloads the value currently stored inx1intow0,retat the end will return the “original” value, which is the value that was atx1before it is swapped. If you wonder why it usesx1and notx2, that’s because right before theldaxr, it adds the values stored in registersx1andx2and stores the result inx1. It does that becausex2(w2) is reused as the status register forstlxr.stlxr w2, w3, [x1]:stlxr(store-release exclusive register) performs an exclusive store of a 32-bit value inw3(which is the lower 32 bits ofx3) to the memory address specified by the value in thex1register. This is where the value gets swapped with1(stored inx3). The store operation is performed only if the exclusive access monitor for the memory address range is still set by the current processor, which was set by the priorldaxrinstruction. If the store operation is successful, the exclusive access monitor is released, and0is stored in the status registerw2. If the operation fails (for example, the exclusive access monitor has been released by another processor or thread), a non-zero value is stored in the status register.cbnz w2, #-0x8 (addr 0x44dc8c746a4):cbnz(compare and branch on non-zero) checks if the value in thew2register (the status register used bystlxr) is non-zero and, if so, branches to the specified address (0x44dc8c746a4), which is the address for theldaxrinstruction, to retry the atomic RMW operation. This is where it loops until the operation was successfully performed without being interrupted by another thread.
What’s being generated here is a load-linked/store-conditional (LL/SC) loop. LL/SC are a pair of instructions used to, for example, implement atomic RMW operations. They are designed to help coordinate access to shared memory resources by multiple threads or processes, ensuring that operations are performed without being interrupted by other threads. On arm64, V8 and SpiderMonkey implement RMW Wasm instructions using a LL/SC loop via the load-acquire exclusive (ldaxr) and store-release exclusive (stlxr) instructions. Remember that LSE was only introduced with Armv8.1. This means that RMW operations had to be implemented using LL/SC before LSE, which seemed fine at first. However, they suffer from thread contention.
Thread Contention
Thread contention is when two or more threads in a multi-threaded application compete for shared resources. If the number of processors is small, this works just fine. However, achieving fairness becomes more challenging as the number of processors increases. For example, in a system with many processors, processors closer to each other regarding their physical location or communication paths may have an advantage when accessing shared resources, such as caches or memory. This can lead to some processors accessing data more quickly than others. Furthermore, if multiple threads try to access the same resource simultaneously, it can lead to overall performance degradation, deadlocks, starvation, or priority inversion.
And this is what happened with WebContainers and tools like esbuild. The LL/SC loop performs poorly under contention because if a thread gets interrupted in the middle of the exchange, it will retry and, in the worst case, keep spinning for a long time. The threads seemed to rarely complete the sequence without having to retry.
Let’s have a look at an example to better understand what it means if a thread gets interrupted:
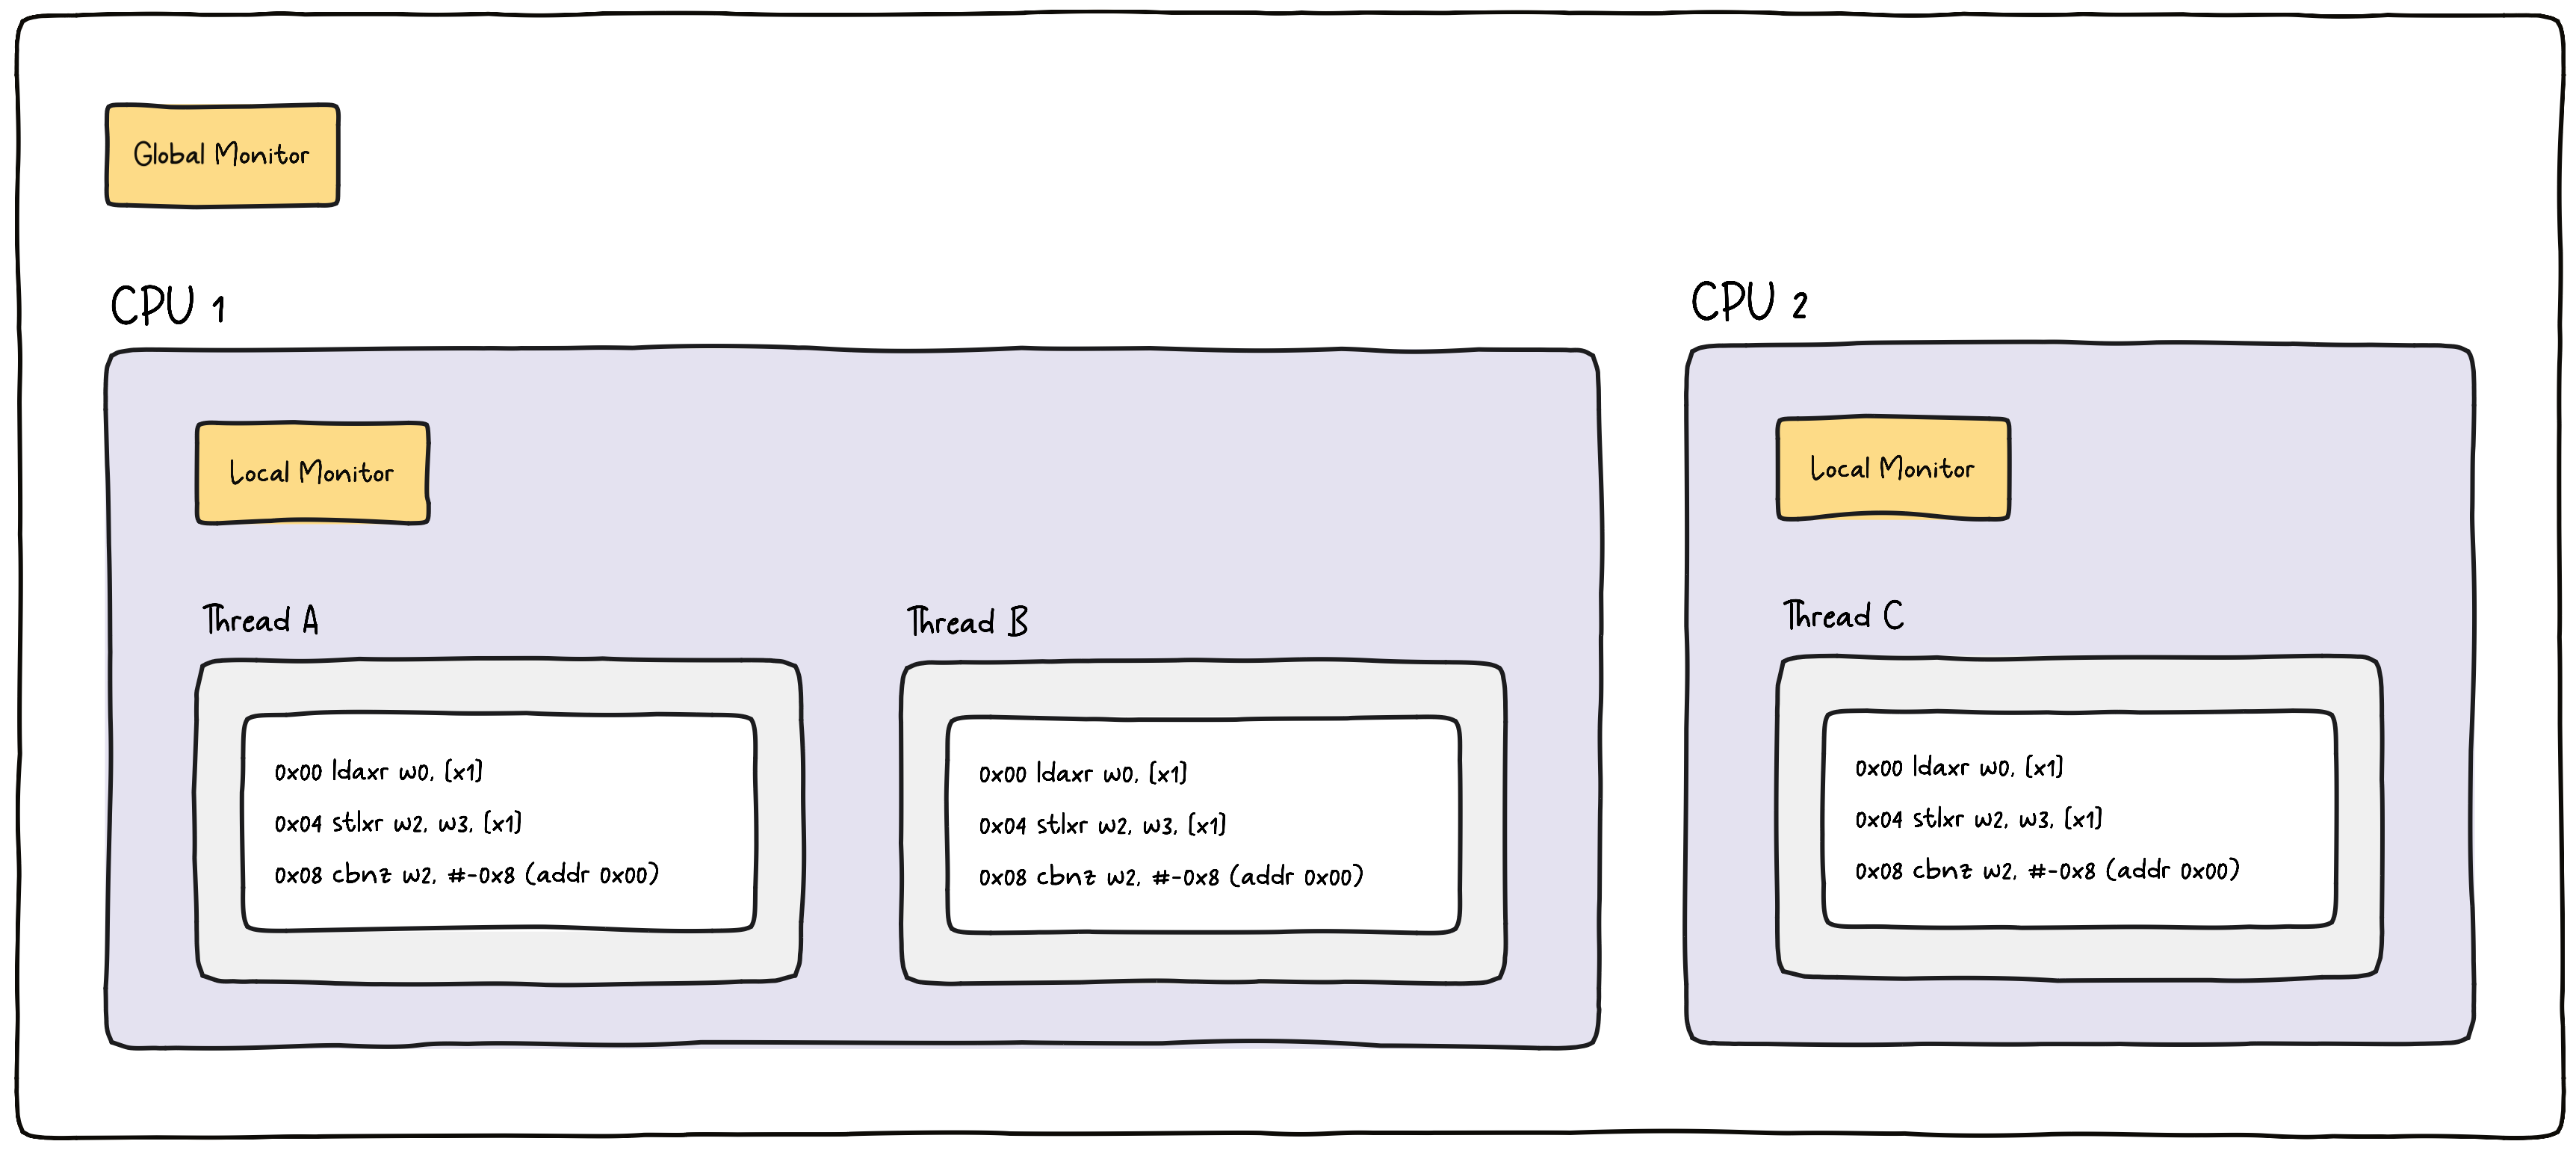
Let’s consider a scenario with two CPUs, and three threads, A, B, and C. All threads run the same code (for example, our Wasm module) that uses an atomic RMW operation to swap some value in memory. We assume that the underlying architecture doesn’t support native RMW operations (prior to Armv8.1) and instead uses a LL/SC loop. As mentioned, ldaxr sets an exclusive access monitor, a simple state machine, with the possible states open and exclusive. To implement this, a system must have two sets of monitors, local and global. The local monitor is per CPU, whereas the global one is, as the name suggests, global, so shared across CPUs.
Local Monitor
The local monitor is useful for those cases where multiple threads are executed by the same CPU. When CPU 1 executes the ldaxr instruction for thread A, it will set the state of the local monitor to exclusive. Note that a CPU can execute only one instruction at a time, even when running multiple threads. To allow for this, an OS uses a technique called context switching. In context switching, the CPU switches between different threads, for example, when an interrupt occurs (for instance, I/O completion or timer expiration), system calls (for instance, when a process requests a service from the OS), or voluntarily (for example, when a process yields the CPU to another process).
Now, suppose the CPU switches to thread B before executing the stlxr instruction from thread A. In this scenario, when the OS switches the context, the local state from all threads is reset (set to open). The CPU then executes instructions from thread B and eventually switches back to thread A. When it does, it executes stlxr, but it checks the local monitor before the value gets swapped in memory. In our case, the local monitor is no longer set to exclusive due to the context switch. As a result, the atomic operation gets interrupted, and stlxr stores a non-zero value in the status register. Next, cbnz is executed and will branch back to the beginning of the loop due to the non-zero status value.
Global Monitor
The global monitor is used when multiple threads are executed on different CPUs. Each CPU can mark an address as “monitored” and detect if other CPUs write to that address. So, stlxr will check not only the local monitor but also the global monitor. This means that even if thread A was not interrupted by a context switch, it could be get interrupted by another thread executed by a different CPU. For example, if CPU 2 executes stlxr for thread C before CPU 1 could execute the same instruction for thread A, thread A has to retry because the global monitor has noticed that the address watched by CPU 1 has been written to.
LSE to the Rescue
A solution for arm64 was introduced with Armv8.1 and LSE atomic instructions. With LSE, atomic instructions provide non-interruptible atomic operations, including RMW operations. This means that a RMW operation can be completed in a single instruction, without the need for an LL/SC loop. These new instructions are more performant and eliminate the issue of thread contention.
LSE in V8
Earlier we checked out the commit before LSE was implemented in V8. Now, let’s go back to the main branch and re-compile V8. Once finished, we can re-run d8 using the exact same command as before which will produce the following outout:
--- WebAssembly code ---
name: wasm-function[0]
index: 0
kind: wasm function
compiler: TurboFan
Body (size = 64 = 64 + 0 padding)
Instructions (size = 56)
0x330581e8680     0  a9bf7bfd       stp fp, lr, [sp, #-16]!
0x330581e8684     4  910003fd       mov fp, sp
0x330581e8688     8  d2800110       movz x16, #0x8
0x330581e868c     c  a9bf43e7       stp x7, x16, [sp, #-16]!
0x330581e8690    10  f841f0e1       ldur x1, [x7, #31]
0x330581e8694    14  8b416381       add x1, x28, x1, lsr #24
0x330581e8698    18  d2800002       movz x2, #0x0
0x330581e869c    1c  d2800023       movz x3, #0x1
0x330581e86a0    20  8b020021       add x1, x1, x2
0x330581e86a4    24  b8e38020       swpal w3, w0, [x1]
0x330581e86a8    28  910003bf       mov sp, fp
0x330581e86ac    2c  a8c17bfd       ldp fp, lr, [sp], #16
0x330581e86b0    30  d65f03c0       ret
0x330581e86b4    34  d503201f       nop

Safepoints (entries = 0, byte size = 8)

RelocInfo (size = 0)

--- End code ---
0
1
If we look closely we notice that the LL/SC loop is no longer present. Instead, I want us to pay attention to the following:
0x330581e86a4 24 b8e38020 swpal w3, w0, [x1]
What we see is a single instruction swpal. The swpal (swap word) instruction is an atomic memory operation that performs a swap between a register value and a memory location. It loads a 32-bit word from memory, stores the value from a register back to the same memory location, and returns the initial value loaded from memory in a destination register. All these operations are performed atomically by a single instruction, which means it cannot be interrupted by other threads or processes. More specifically:
w3is the source register, holding the value that will be swapped with the value in memory.w0is the destination register, which will receive the value initially loaded from the memory location after the swap.[x1]is the location in memory where the swap will take place.
After the swpal instruction is executed, the value originally in memory (at the address in x1) will be in the w0 register, and the value initially in the w3 register will be in memory (at the address in x1).
LSE in SpiderMonkey
For fun, I did the same for SpiderMonkey using it’s JavaScript shell. For that I compared the current main branch (default) with the fix from Yury and the code is somewhat identical.
Here’s the code before the fix:
...
0x2904e76b8014  52800000  mov     w0, #0x0
0x2904e76b8018  52800021  mov     w1, #0x1
...
0x2904e76b8024  885f7e02  ldxr    w2, [x16]
0x2904e76b8028  88117e01  stxr    w17, w1, [x16]
0x2904e76b802c  35ffffd1  cbnz    w17, #-0x8 (addr 0x2904e76b8024)
...
It’s the same exact LL/SC loop but uses ldxr and stxr instead of ldaxr and stlxr respectively. The difference between these instructions is that ldaxr enforces an acquire barrier and stlxr enforces a release barrier. Both are used to ensure memory access ordering. For this blog post, it’s not really relevant to understand what this means, and it is a topic for another day.
Now, let’s have a quick look at the code that gets generated with the fix:
...
0x38c6d11dc014  52800000  mov     w0, #0x0
0x38c6d11dc018  52800021  mov     w1, #0x1
...
0x38c6d11dc024  b8e18202  swpal   w1, w2, [x16]
...
That looks familiar, doesn’t it? As we can see, SpiderMonkey now also uses swpal. The fix is expected land in Firefox 114 which is expected to ship on June 6, 2023 🙌 👏. If you want, you can already try it out in the current Nightly version of Firefox.
Happily Ever After
When we first encountered issues with atomic operations on arm64, we tried to find a workaround on our end. However, it wasn’t easy to work around because, as we now know, it turned out to be a pretty low-level issue with the machine code that browser engines generate. What we did try, though, was to use the JS Self-Profiling API. However, we figured the issue vanished into thin air once the profiler ran. So, we thought, why not detect Apple Silicon and use the Profiler API programmatically at the cost of slowing down the execution. If that could fix the problem for our users for the time being and allow for broader adoption, then that would be a good bullet to bite. Unfortunately, using the Profiler API did not do the trick and fix the issue. Plus, it’s only currently supported in Chrome.
It’s unclear why the profiler fixed the performance issue. But the browser’s built-in profiler works through sampling. At regular intervals, a sampling thread interrupts most, if not all, of the threads within the program. During the interruption, the sampling thread tracks the call stack of the thread and generates a statistical profile indicating where the program spent the most time. It’s possible that this interruption was able to end the spinlock that these threads would experience using the LL/SC loops. OS thread scheduling can have a big impact here, and interrupts mess with that.
If you’re intrigued, you could have a look at V8’s stack sampling profiler
That was a bummer. We quickly realized we couldn’t work around the problem ourselves and had to wait for a proper fix. That’s why we promptly filed issues for Chrome and Firefox and closely monitored the progress. Safari was not affected by the performance issue and worked as expected 👏. The good news is that the issue has been fixed as of Chrome 112 and Firefox 114!
With that in mind, if you are using Apple Silicon or arm64 and have experienced performance issues with WebContainers, we strongly recommend updating to the latest version of Chrome and trying again. This should improve the performance and allow it to run at full throttle 🏎️.
Let’s Recap
- Large System Extensions (LSE) is a set of extensions introduced with Armv8.1, which enhance the architecture to better support large-scale multi-core systems.
- LSE improves the performance, scaleability, and efficiency of these systems by introducing new non-interruptable atomic instructions that handle synchronization more efficiently.
- The WebAssembly Threads proposal introduces shared linear memory as well as atomic memory access instructions including read-modify-write (RMW) instructions.
- WebContainers and other tools use RMW instructions.
- Before LSE, Arm didn’t natively support RMW instructions so browser engines relied on LL/SC loops.
- The problem with LL/SC loops is that they may suffer from high contention, which can lead to performance issues.
- With Armv8.1, browser engines like V8 and Spidermonkey can generate LSE instructions instead of LL/SC loops.
- Performance issues with Apple Silicon (arm64) that impact WebContainers have been fixed as of Chrome 112 and are expected to ship with Firefox 114.
Further Reading
If you want to learn more about the Arm CPU architecture, check out the official Arm documentation with how-to guides and tutorials.
In case you are intrigued to delve into the subject of memory access ordering, check out this discussion from Linux.